
Desk
Reporting
Trackers
Maps
Tools
In our 2nd presidential election poll which was conducted from August 9-23, we asked 2,700 respondents to estimate the percentage of votes each of the top 4 candidates will receive in the election. The data we gathered provide fascinating insights into voters thinking patterns and highlight which campaigns have garnered the most resonance among the electorate.
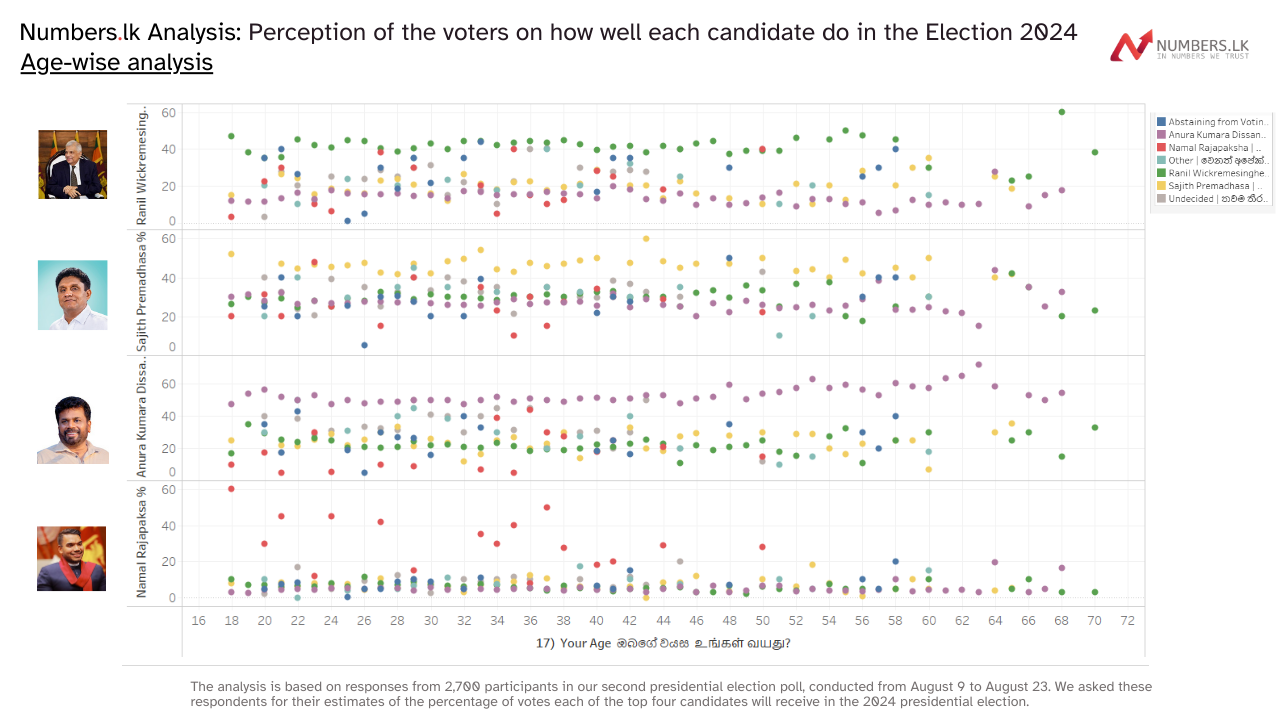
In our second presidential election poll, conducted from August 9 to August 23, we asked respondents to estimate the percentage of votes each of the top four candidates will receive in the election. We posed four questions in the following format:
What percentage of the vote do you estimate [Candidate Name] will receive in this election?
The poll was conducted in all three languages and surveyed 2,700 adults across all 22 electoral districts. These estimates by the voters offer key insights into voters' perceptions of the upcoming election and the general mood of the country as we approach September 21, 2024. Here are the key takeaways:
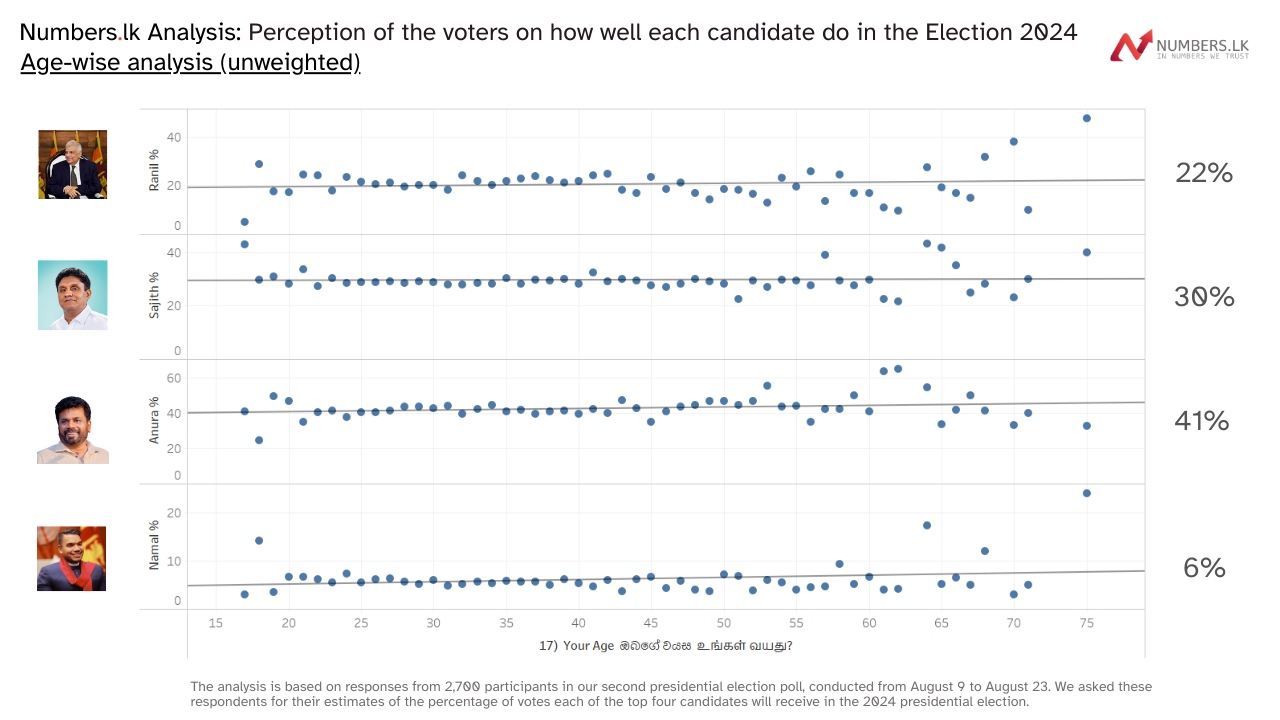
Perception of the voters on how well each candidate do in the Election 2024 | Age wise analysis (unweighted)
Contrary to popular belief, our data show that voter perceptions of a candidate's chances are consistent across different age groups. Whether we ask 20-year-olds or 40-year-olds to estimate the election results, their average predictions tend to be closely aligned, assuming each group has a sufficiently large sample size. (Note: Standard deviation and variance may vary.) This indicates a general consensus on how the election might unfold, suggesting that voter perceptions remain consistent across all age groups.
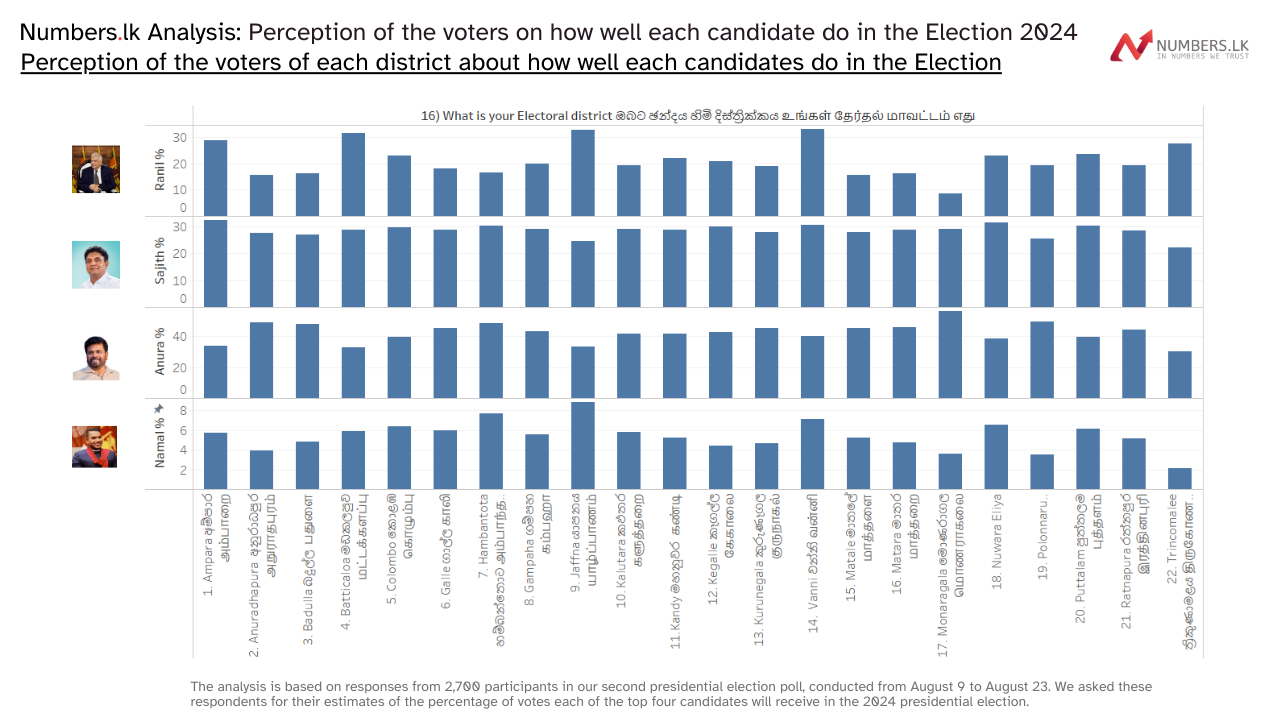
Perception of the voters of each district about how well each candidates do in the Election
The data shows that perceptions of a candidate’s performance shift significantly based on the respondent's electoral district, highlighting regional variations in political landscapes and the influence of localized campaigns.
For example, voters in districts such as Anuradhapura, Monaragala, Polonnaruwa, and Badulla believe Anura Kumara Dissanayake is performing better compared to voters from other districts. Same is the case for Ranil Wickremesinghe for Ampara (Digamadulla), Vanni, Jaffna, and Trincomalee districts. The estimates for total vote percentage for Sajith Premadasa is higher from the voters from Ampara, Vanni, and Nuwara Eliya than those from other regions in the country. In Namal Rajapaksha's case, only the voters from Jaffna,Vanni and Hambantota believe he can get to 7%.
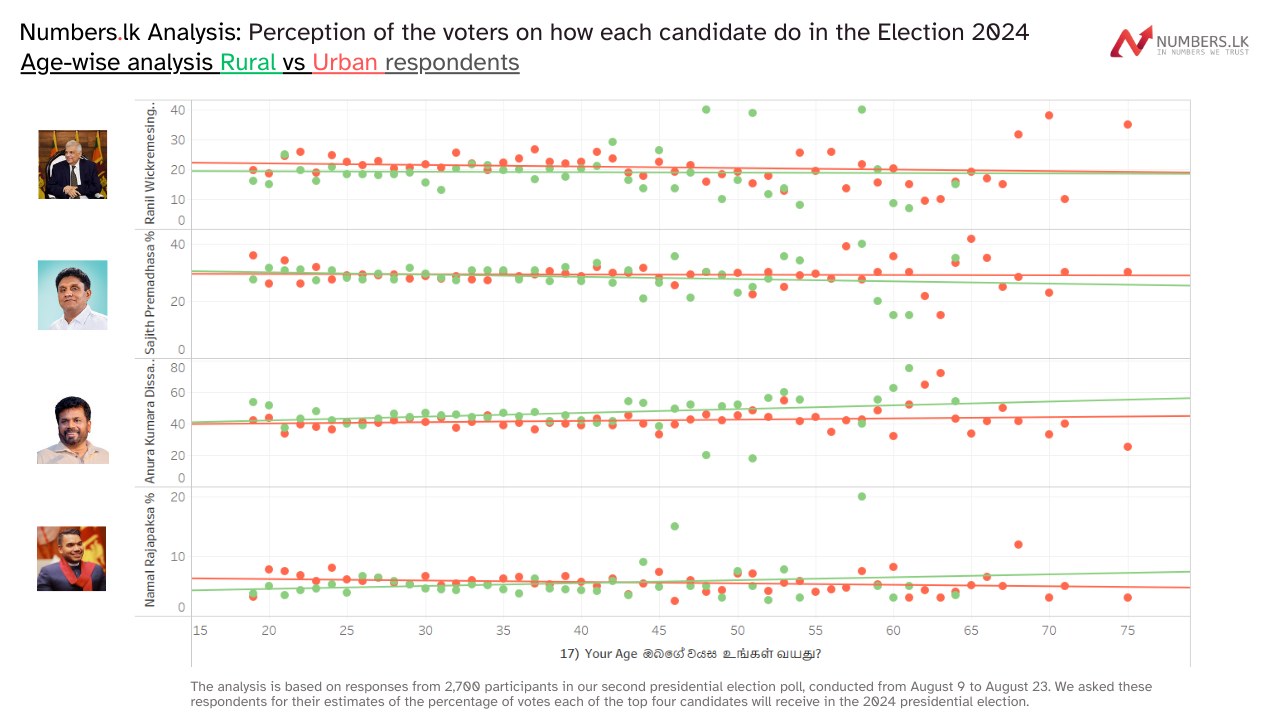
Age wise analysis Rural vs Urban respondents
Contrary to popular belief, our data indicates that the voting patterns of rural and urban voters do not significantly differ in the upcoming election. The analysis shows only minor variations in the voting preferences of certain candidates, depending on whether voters are from urban or rural areas.
Anura Kumara Dissanayake is the only candidate who performs better among rural voters, with a marginal advantage of about 3-5%. On the other hand, Ranil Wickramasinghe has slightly higher support among younger urban voters compared to rural voters. Sajith's support is nearly identical across both rural and urban populations. Namal Rajapaksha is an interesting case, as he garners support from both younger urban voters and older rural voters, leading to intersecting trendlines in his voter base.
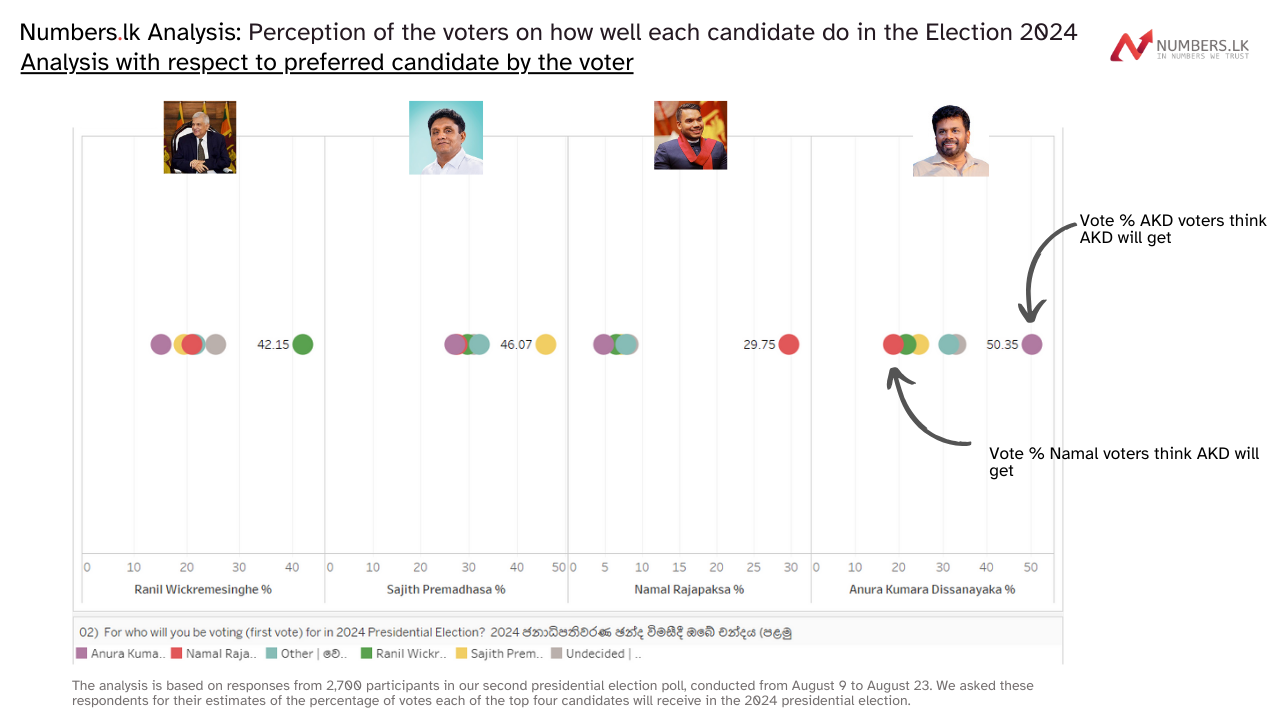
Analysis with respect to preferred candidate by the voter
The most significant factor affecting voter perception is which candidate a respondent supports. Supporters of each candidate tend to estimate a higher percentage of votes for their preferred candidate, reflecting a bias toward optimism in their expectations.
AKD supporters have the highest confidence in their candidate, estimating that he will receive more than 50% of the vote. Sajith's supporters are close behind, with an average estimation of 46%. Sajith also has the most agreed-upon consensus among voters who do not support him, with most estimates placing his support at around 30%. Ranil's voters seem more conservative in their estimates, predicting only 42% for their candidate. Namal's voters are also very optimistic, estimating 29% support for their candidate in the upcoming election, despite his overall standing at around 6%.
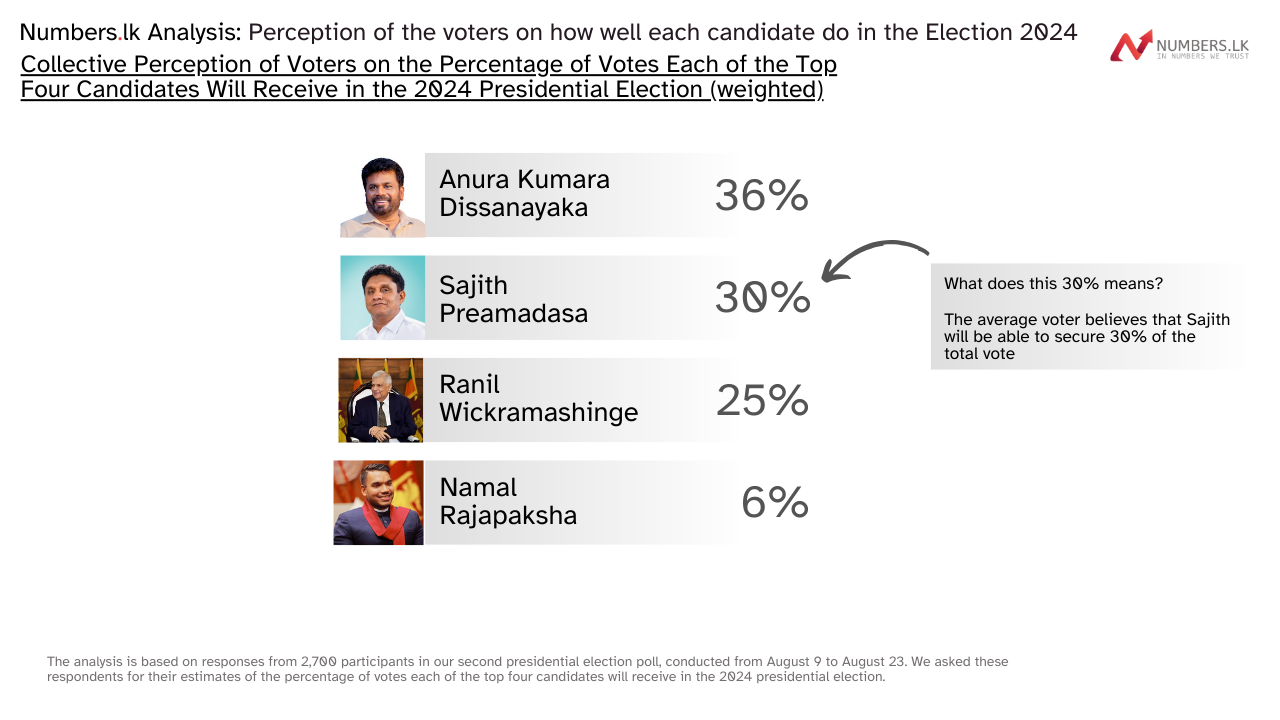
By averaging and weighting voter estimates based on demographics, we can accurately gauge the overall perception of voters regarding the upcoming presidential election. According to our data, voters collectively estimate that AKD will receive 36% of the total vote, Sajith 30%, Ranil Wickremesinghe 25%, and Namal Rajapaksha 6%.
It's important to understand that there is a difference between how people think the percentages will be in an election and how they actually vote. For example, according to our pre-election poll results, Namal Rajapaksa has only 3% support among actual voters, but the voters collectively the same sample think he will receive 6% of the vote. Similarly, while voters believe Sajith will get 30% of the vote, our poll indicates he is likely to receive only 22% of the vote.
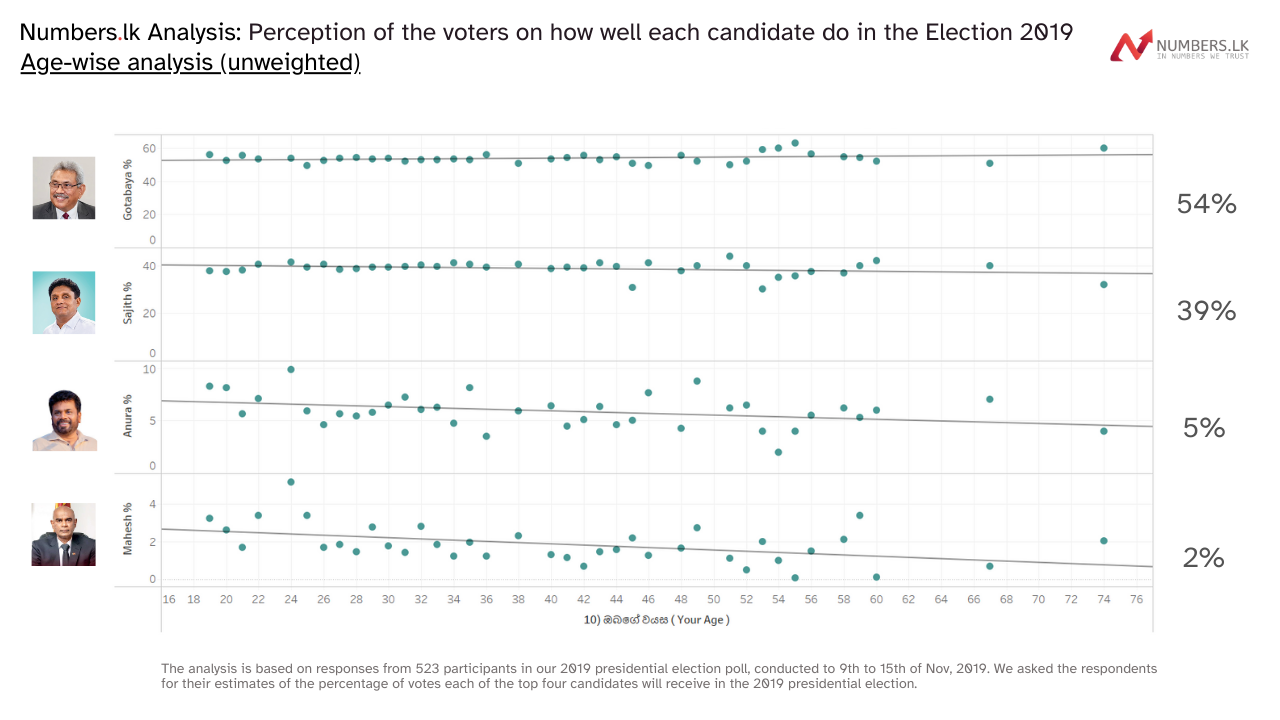
In 2019, we found that collective voter perception was one of the most accurate predictors of the election outcome. The weighted average of respondents' predictions closely matched the actual results. Despite individual biases, when voter predictions are averaged across the entire sample, they provide a remarkably accurate forecast of the election outcome. This collective wisdom, when weighted appropriately, can serve as one of the most reliable models for predicting elections.
....එහි පළමු ක්රමය වශයෙන් ඡන්ද දායකයින් 523 ක් වෙතින් අප වෙත ලැබුණු ඔවුන්ට අනුව එක් එක් අපේක්ෂකයා ලබා ගන්නා ඡන්ද ප්රතිශත අනුමාන අප විසින් විශ්ලේෂණය කර සමස්ථ ඡන්ද ප්රතිශතයෙන් කවර ප්රතිශතයක් එක් එක් අපේක්ෂකයා ලබා ගන්නේද යන්න ගණනය කරන ලදී. පහත දැක්වෙන්නේ එහි ප්රථිපලයි. pic.twitter.com/HFVguMxABj
— Numbers.lk (@numberslka) November 16, 2019